
the bearing adjustment, which is cannot be ignored after installing.
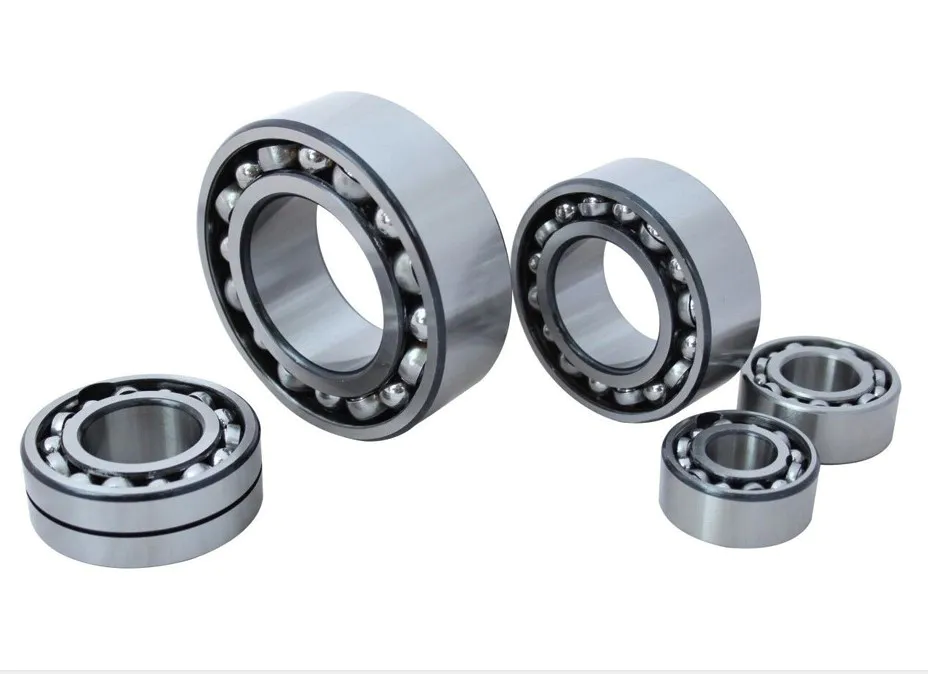
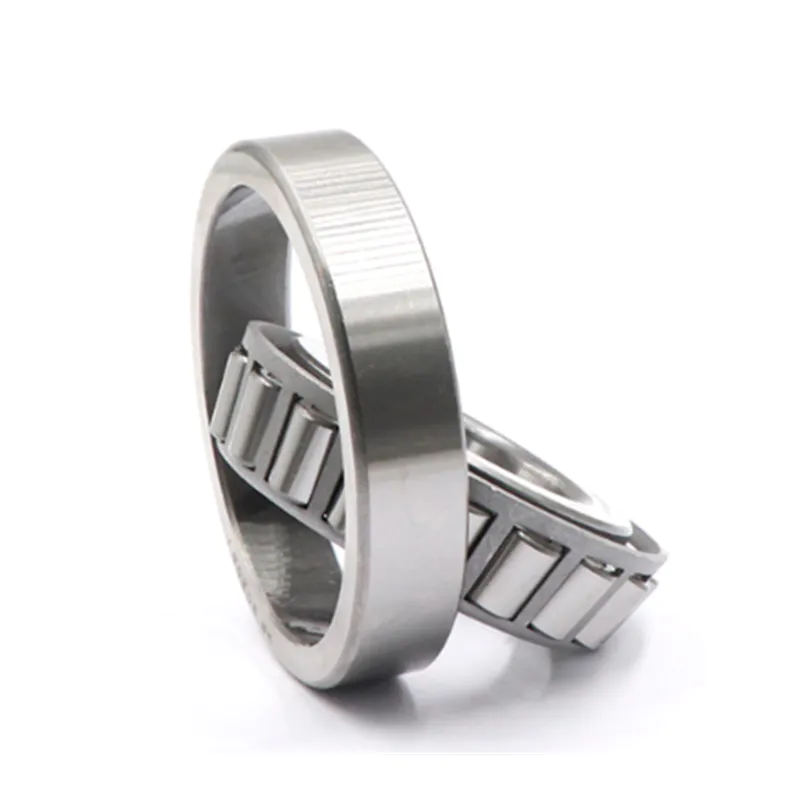
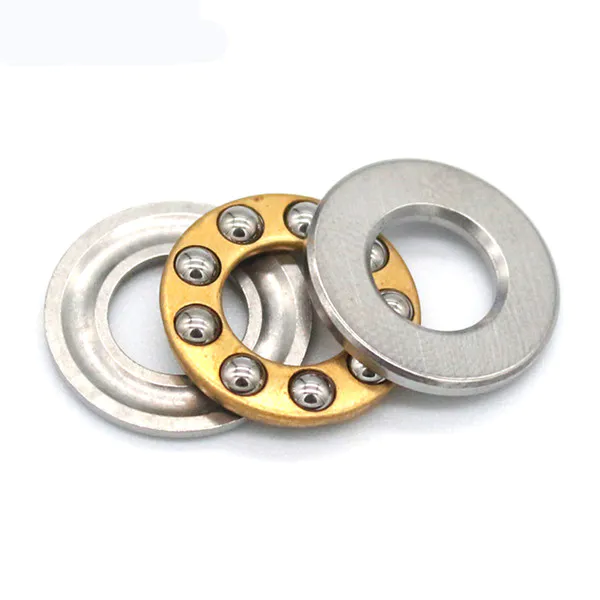
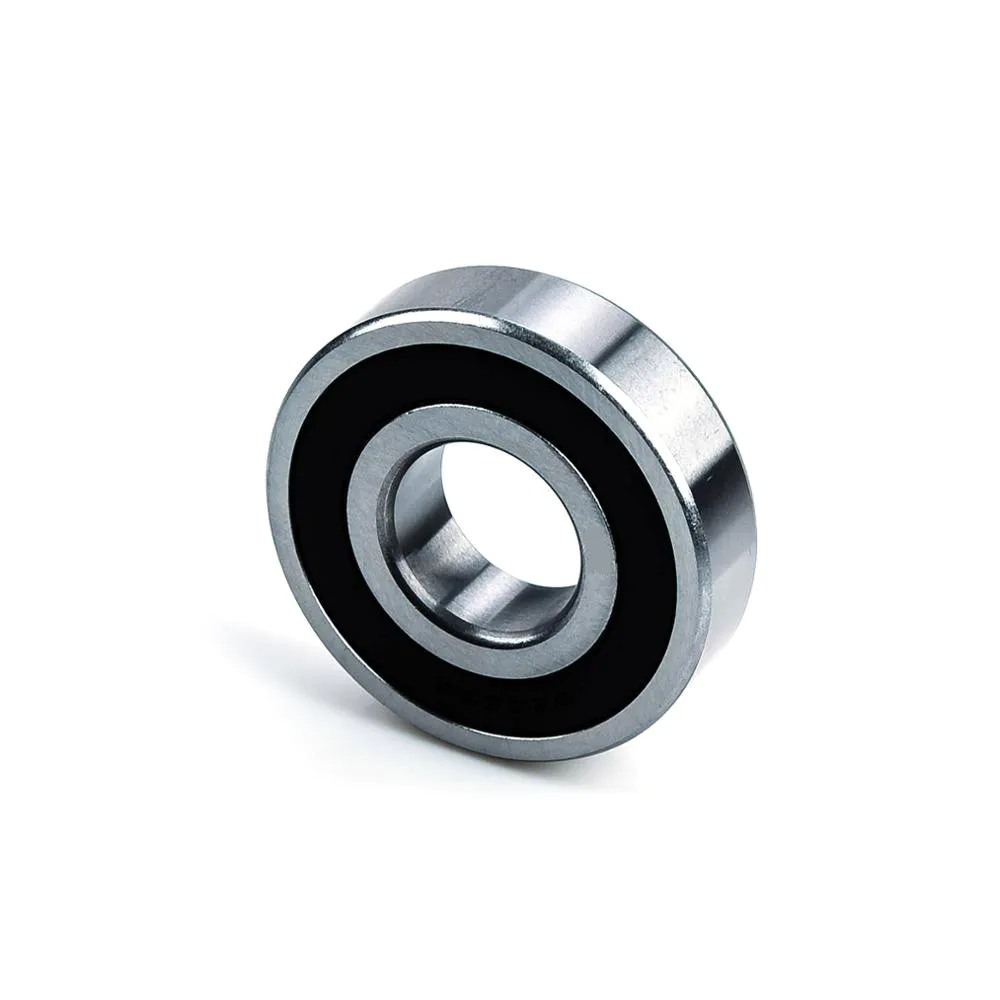
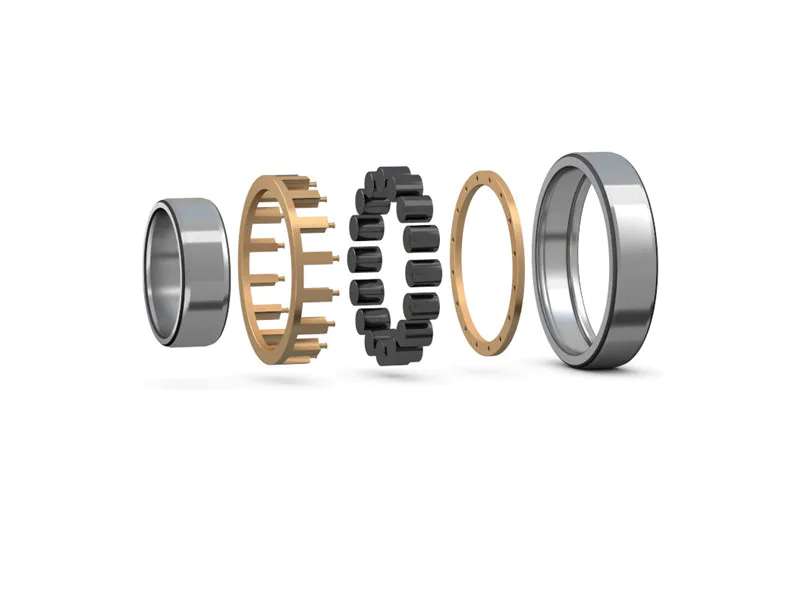
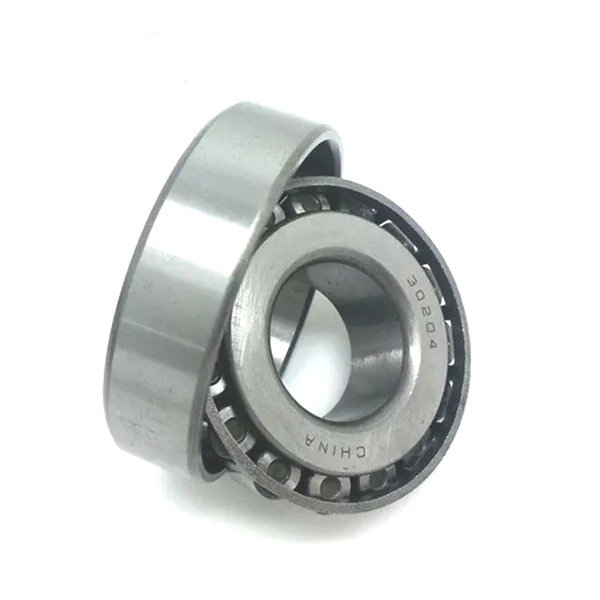
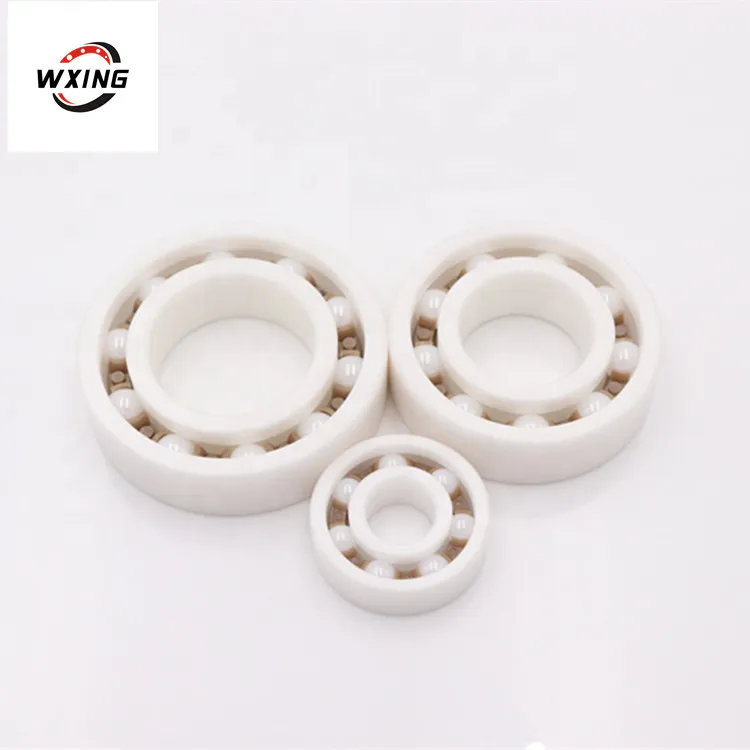
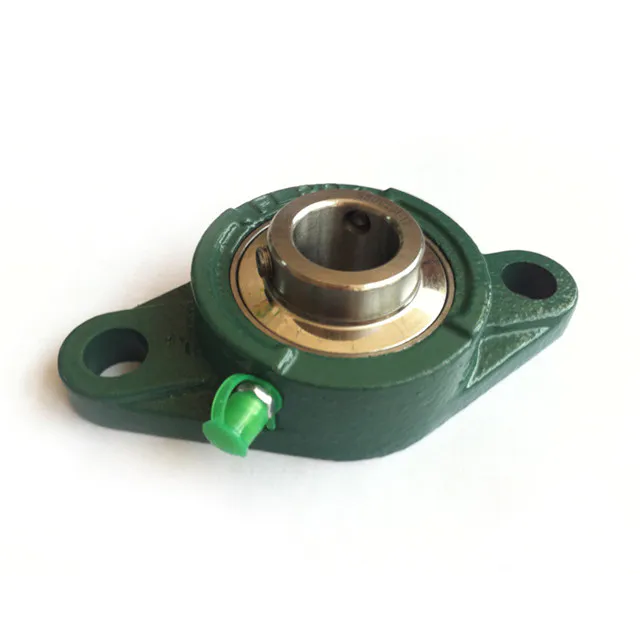
PRODUCT
The stability analysis of rolling bearing vibration experimental data
by:Waxing
2020-06-17
Sound of rolling bearing vibration experimental data analysis: the experiment USES the code-named C, a total of 4 sets of rolling bearings, and vibration measuring instrument with special experimental equipment of rolling bearing vibration measurement, a data every unit time measurement, each set bearing vibration measuring 901 data, namely the m to 4, 901 N.
According to figure 3 -
7 1 ~ 4 sets of rolling bearing vibration data diagram of c, you can see c bearing vibration in -
3 -
3 umn/s within the scope of the change of each bearing range is different.
The range of 3 sets of bearing largest for -
3~3um/s;
1, 2 sets of smaller range of bearing, for -
0.
8 to 0.
8um/s;
Minimum set of bearing vibration range, 4 -
0.
3 to 0.
3μm/s。
From each bearing vibration data can be found in the figure, some vibration data is very big, some small vibration data, explain C rolling bearing vibration is discrete data.
The following analysis of rolling bearing vibration data robustness.
Since C rolling bearing vibration experiment data for 901, according to the statistics, can think of is normal distribution.
According to table 3 -
1 each C rolling bearing vibration data can be divided into 28 groups, according to the mathematical model to make the histogram of each set of bearing vibration.
C rolling bearing vibration data histogram in May form, such as 2, 3 sets of frequency distribution of bearing;
Some shows bimodal type, such as the frequency distribution of 1, 4 sets of bearings.
Visual C rolling bearing vibration no consistent distribution, presents the complexity and diversity.
After compared with normal distribution density function, it can be seen c rolling bearing vibration of the histogram with the normal distribution density function, namely c rolling bearing vibration data does not obey the normal distribution.
Due to the number of experimental data for 901, according to the statistics can be thought of as the normal distribution or asymptotic normal distribution, but the histogram with the normal distribution density function, existing in rolling bearing vibration data discrete data, is not healthy.
After the C rolling bearing vibration data to normality.
Figure 3 -
9 for C normality test picture of rolling bearing vibration.
Diagram, lines for normal distribution line, curve for rolling bearing vibration cumulative frequency curve C.
If accord with normal distribution, cumulative frequency curve and linear superposition;
Otherwise, do not overlap with straight line.
According to figure 3 -
9 you can see, C rolling bearing vibration cumulative frequency curve is not coincide with the normal distribution line, explain C rolling bearing vibration data not completely obey the normal distribution.
Among them, the middle part of the rolling bearing vibration cumulative frequency curve and linear superposition, illustrate intermediate data obey the normal distribution;
Rolling bearing vibration on both ends of the cumulative frequency curve and linear superposition, part of the data does not obey normal distribution on both ends of the instructions, the part at the ends of the data are discrete data.
Specific to each bearing, the situation and difference.
For a single set of bearing vibration data, some serious deviate from normal distribution line, such as 3, 4 sets of bearings;
The rest of the bearing deviating from the normal distribution is not serious;
Some bearing minimum and maximum deviation from normal distribution was widespread, such as 3, 4 sets of bearings;
Some bearing minimum and maximum deviation from normal distribution range is small, such as 1, 2 sets of bearings.
As you can see, C rolling bearing vibration diversity and complexity, the probability distribution of vibration do not accord with normal distribution, unsound C rolling bearing vibration experimental data.
Custom message
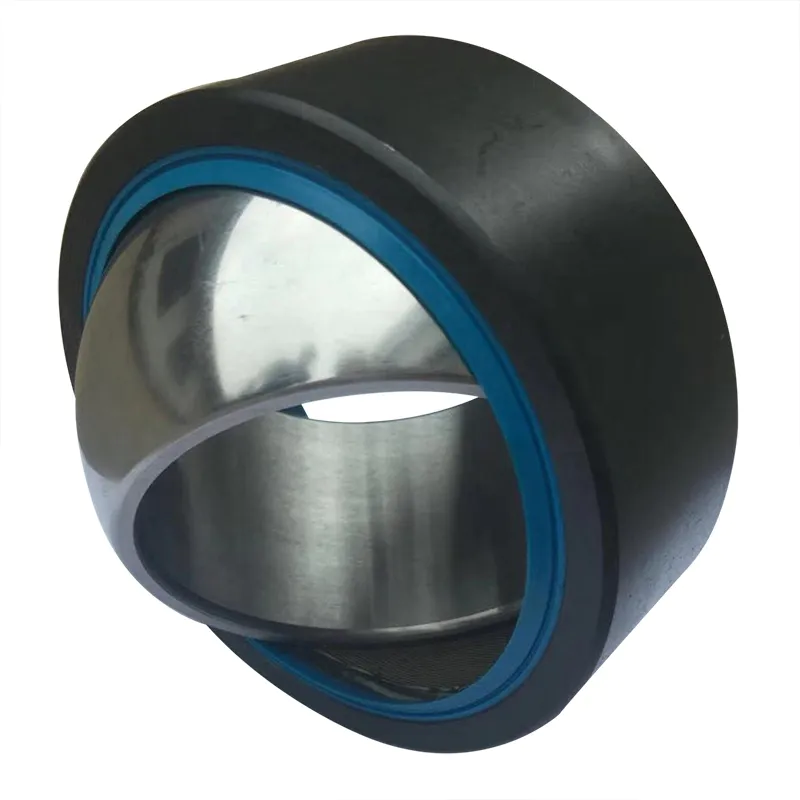
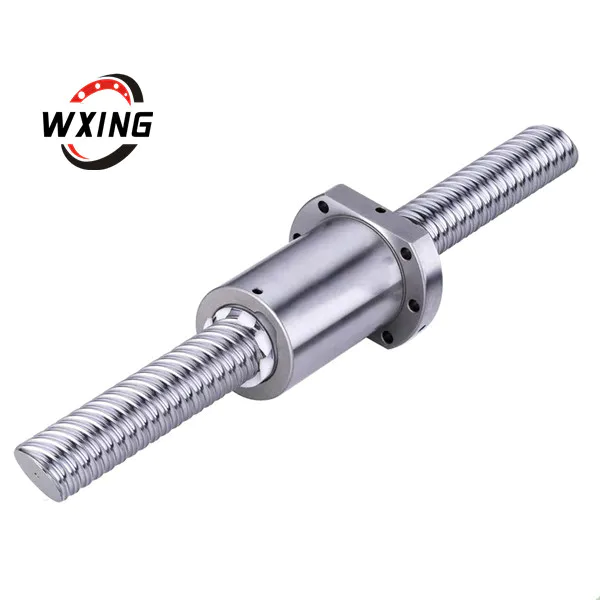
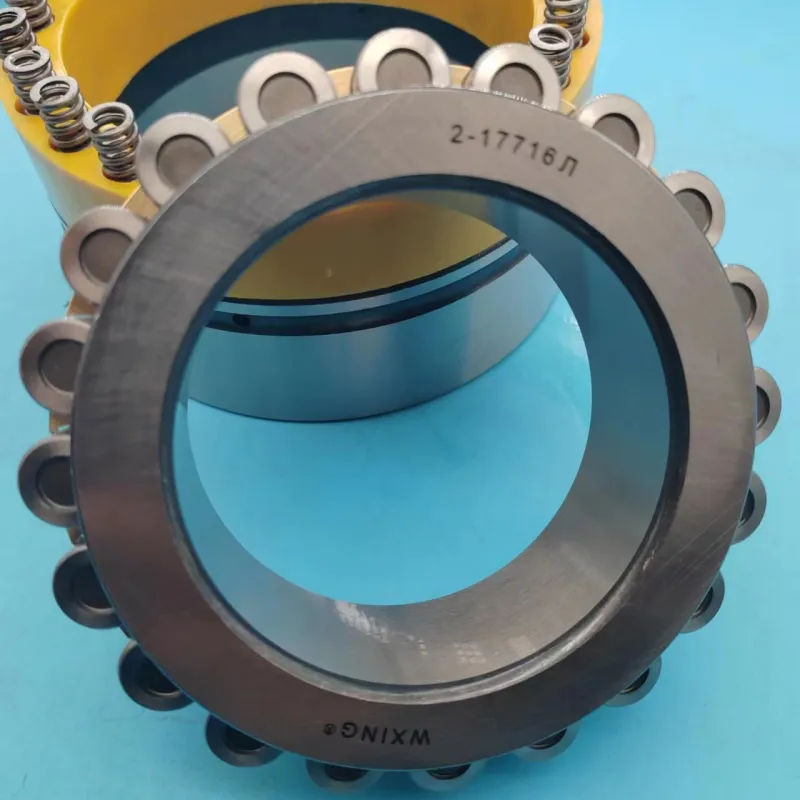
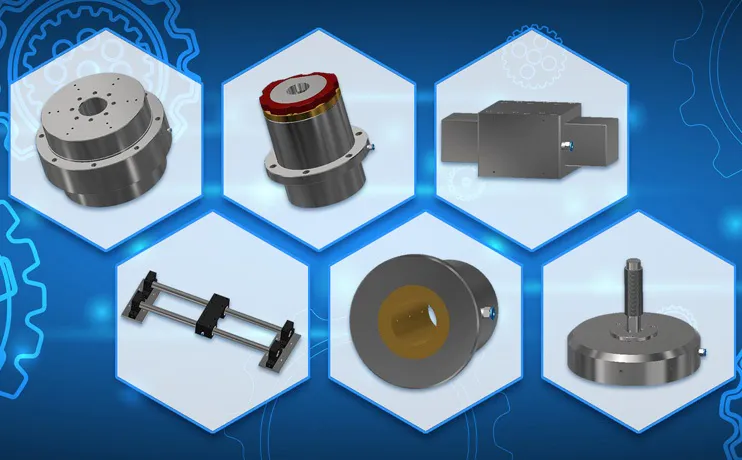
Related Products